| Pages:
1
2 |
PHILOU Zrealone
International Hazard
    
Posts: 2893
Registered: 20-5-2002
Location: Brussel
Member Is Offline
Mood: Bis-diazo-dinitro-hydroquinonic
|
|
Quote: Originally posted by Hennig Brand  |
[Delta] = E(_m_/M)
where,
[Delta] = temperature change for 100g of solvent
m = mass of solute
M = molecular weight of solute
E = Constant (70.5 for NG)
or
dT = Kc * (m/M)/kg
Divide E = 70.5 by 10 to give Kc = 7.05 and we have the same equation, except now it measures temperature change for 1kg (1000g) of solvent not 100g
anymore.
The first way above, from Nitro Explosives, is likely not conventional anymore, but I think it gives the same results.
I didn't intend for what I did to be the final word on NG/EGDN phase diagrams. I found a few bits of information on the internet, and got a start on
it. Though probably very inaccurate, it was still a very worthwhile exercise because of what was learned/is being learned.
[Edited on 10-4-2016 by Hennig Brand] |
I also figured the Kc out   and to be 1/10 of E. and to be 1/10 of E.
Your graphical proposition is stil very interesting and maybe by chance somehow right or close to reality...I don't know and hard to tell.
Maybe is there a way to take into account the mutual effect...
dTa = Kac * (ma/Ma)/kg
dTb = Kbc * (mb/Mb)/kg
On the edges but additive effect inbetween...
a bit like (a+b)2=a²+b²+2a.b ...two pure effects and an additive...but I haven't found a way to make the things go work.
[Edited on 10-4-2016 by PHILOU Zrealone]
PH Z (PHILOU Zrealone)
"Physic is all what never works; Chemistry is all what stinks and explodes!"-"Life that deadly disease, sexually transmitted."(W.Allen)
|
|
|
Hennig Brand
International Hazard
    
Posts: 1284
Registered: 7-6-2009
Member Is Offline
Mood: No Mood
|
|
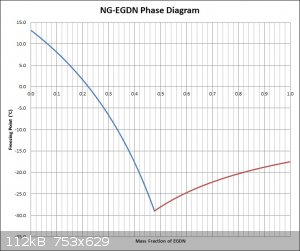
NG/EGDN Phase Diagram (Revisited)
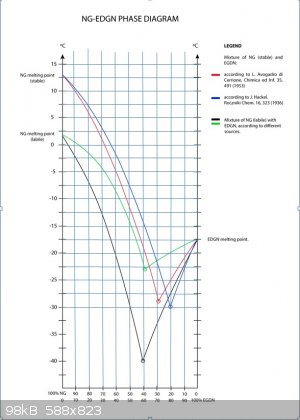
It is assumed at this point that some values found were for mixtures with stable NG and some with labile NG. I decided to use the value of -29C as the
eutectic point this time around, since that is about what is seen in the graph provided by Bender84 for mixtures with stable NG, also the same
freezing point value is floating around the internet for the temperature mixtures of NG and EGDN can go to (Encyclopedia Britannica, etc). Also to
keep the new graph more inline with the graph provided, I used -17.5C as the freezing point of pure EGDN. The graph was also done with freezing point
versus mass fraction of EGDN (mirror image of the old graph) to use the same convention as the provided graph which will make comparisons easier.
Attached is a jpg of the graph. I can provide the Excel sheet too if desired.
The graph still looks quite different than the one provided.

[Edited on 11-4-2016 by Hennig Brand]
"A risk-free world is a very dull world, one from which we are apt to learn little of consequence." -Geerat Vermeij
|
|
|
Hennig Brand
International Hazard
    
Posts: 1284
Registered: 7-6-2009
Member Is Offline
Mood: No Mood
|
|
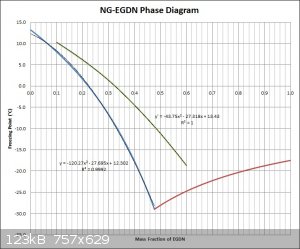
Playing with these graphs again a little bit. I fairly carefully drew a grid onto the graph provided and then read values, from 10% to 60% EGDN in
increments of 10%, from the red curve involving stable NG. The values obtained matched a quadratic curve very closely, with an R squared value of
0.999955 (shown as the green colored curve in the middle graph above/included with my last graph for comparison purposes). I wonder if the curve
provided was obtained by theoretical calculation or from experimental values.
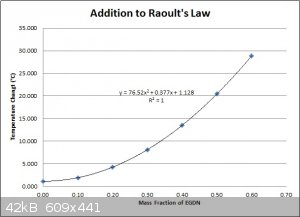
Since the graph I made earlier, based on Raoult's law for freezing point depression, also very closely follows a quadratic function, the difference
between the two equations is also represented by a quadratic function. One equation can simply be subtracted from the other to obtain the difference
equation.
  
[Edited on 22-4-2016 by Hennig Brand]
"A risk-free world is a very dull world, one from which we are apt to learn little of consequence." -Geerat Vermeij
|
|
|
Bender84
Harmless

Posts: 32
Registered: 24-3-2016
Member Is Offline
Mood: No Mood
|
|
Thank you Hennig Brand for all your great work! 
As for the green curve I think that it was obtained using experimental data from earlier works of some polish scientists. But I will ask my colleague
about that to be sure.
In the meantime I would like to ask you if you or anyone interested in the topic, who is reading this post, have any data on NG and EGDN solubility in
water vs temperature and pH? I found some data on solubility of NG vs temperature, but I couldn't find anything about solubility of EGDN in water vs
temperature or vs pH
|
|
|
hissingnoise
International Hazard
    
Posts: 3940
Registered: 26-12-2002
Member Is Offline
Mood: Pulverulescent!
|
|
From Davis's COPAE, Naoúm reported that 1 litre of water @ 15° dissolved 6.2 gm EGDN, @ 20° 6.8 gm (or 1.8 gm NGl) and @ 50° 9.2 gm EGDN!
Not really much to go on ─ a quick google might bring up more . . . ?
|
|
|
Hennig Brand
International Hazard
    
Posts: 1284
Registered: 7-6-2009
Member Is Offline
Mood: No Mood
|
|
I was in a rush and distracted when I made my last post. Just to clarify, the green curve in the Excel generated graph in my last post was made from
values read/estimated from the red curve from the set of curves provided by Bender84.
I do have a bunch of solubility information for NG and EGDN on one or more of my computers. I will post the information when/if I find it.
"A risk-free world is a very dull world, one from which we are apt to learn little of consequence." -Geerat Vermeij
|
|
|
| Pages:
1
2 |