Scientific Diagramming Software
Is there something that you guys can recommend? I already have ChemBioOffice and Electronics Workbench but I would like something that would make it
easier to create diagrams (something that takes up A LOT of time for me right now because I do it in paint--and it looks like crap) quickly, neatly
and efficiently.
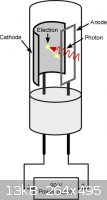
A good example would be the following image (more examples here):

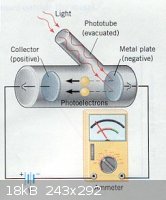
A better example would be this image (how are things like this typically made? Like in a textbook. Are they drawn by artists usually? I can
definitely tell that modern textbooks use computers, Quantum Chemistry and Spectroscopy 2nd Ed. by Engel being a GREAT example):

Thanks!
"There must be no barriers to freedom of inquiry ... There is no place for dogma in science. The scientist is free, and must be free to ask any
question, to doubt any assertion, to seek for any evidence, to correct any errors. ... We know that the only way to avoid error is to detect it and
that the only way to detect it is to be free to inquire. And we know that as long as men are free to ask what they must, free to say what they think,
free to think what they will, freedom can never be lost, and science can never regress." -J. Robert Oppenheimer
|