qw098
Harmless

Posts: 22
Registered: 25-10-2011
Member Is Offline
Mood: No Mood
|
|
NMR Tree Diagram
Hi Guys,
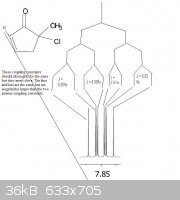
For the peak seen at 7.85ppm (shown below) which is pretty "clean", it seems to be a ddd. However, the smallest coupling constants don't add up. The
two outside coupling constants are equal, but the two interior coupling constants are different than the outside coupling constants, and by a fairly
large amount. Shouldn't the coupling constants in the same level all be equal for a ddd? I have attached a .jpg file to show what I mean.
In final my question is... what is wrong with this NMR Spectrum? If this is indeed a ddd why aren't the coupling constants adding up?!
Thanks!

|
|
|
turd
National Hazard
   
Posts: 800
Registered: 5-3-2006
Member Is Offline
Mood: No Mood
|
|
You seem to miss the fact that in the bottom part of the tree the "branches" can cross. Think about it: what would a "ddd" look like for J=4,5,6 Hz?
Pretty much exactly like your diagram, isn't it?
NMR has always been black magic to me, but this seems to make some sense. BTW: Are you sure you are looking at the correct proton? What does the
signal of the proton at the other side of the double bond look like?
|
|
|
Satan
Hazard to Others
  
Posts: 126
Registered: 1-5-2009
Member Is Offline
Mood: No Mood
|
|
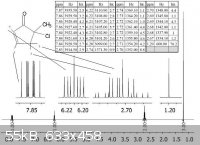
Post whole spectra.
|
|
|
qw098
Harmless

Posts: 22
Registered: 25-10-2011
Member Is Offline
Mood: No Mood
|
|
Thanks. Yes, you are right, I mislabeled my hydrogen. The chemical shift should correspond to the adjacent hydrogen.
Quote: Originally posted by turd  | | You seem to miss the fact that in the bottom part of the tree the "branches" can cross. Think about it: what would a "ddd" look like for J=4,5,6 Hz?
Pretty much exactly like your diagram, isn't it? |
So... How would I draw my tree diagram and find the rest of my coupling constants?

|
|
|
turd
National Hazard
   
Posts: 800
Registered: 5-3-2006
Member Is Offline
Mood: No Mood
|
|
Come one... I gave you the answer.  If you make the tree for J=4,5,6 Hz it will be
obvious which peaks form pairs. If you make the tree for J=4,5,6 Hz it will be
obvious which peaks form pairs.
BTW: This example is obviously simulated. No way a real NMR spectrum would look like this with the shifts being exact to the 5th significant place.
(Answer for the lazy: 6.0, 7.1, 7.9 Hz)
|
|
|
qw098
Harmless

Posts: 22
Registered: 25-10-2011
Member Is Offline
Mood: No Mood
|
|
Thanks for the response!
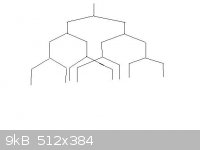
I did draw a diagram! And I got the answer!!! You sir, are AMAZING!  Thank you a
ton!!! To prove to you I drew the diagram please find it attached below Thank you a
ton!!! To prove to you I drew the diagram please find it attached below 
By the way... how was I suppose to know beforehand that there was overlapping between the bottom "branches"? Is this simply a guess I have to do?
Also, may I add... how do I know which hydrogen the coupling constants (6.0, 7.1, 7.9 Hz) couple too. Of course it couples with one of the hydrogens I
am drawing the "tree" for, but how do I know which other hydrogen as well?
Thanks a TON again, I really understand this now  Awesome! Awesome! 

[Edited on 25-10-2011 by qw098]
[Edited on 25-10-2011 by qw098]
|
|
|
qw098
Harmless

Posts: 22
Registered: 25-10-2011
Member Is Offline
Mood: No Mood
|
|
Nevermind, I finished my whole assignment thanks to you sir!!! I've had this assignment for THREE weeks now... thinking about it EVERYDAY and thanks
to YOU sir.. I have figured it out!!!
Thank you x 10000000!!!!!!!! I can't thank you enough!!! That idea that the smallest branches can overlap was ingenious!! Thank you x infinity!
You are the best!! 
|
|
|