Sciencemadness Discussion Board

Home made spectrometer

woelen - 21-11-2005 at 04:34

I ordered a set of LEDs of different colors (red, orange, yellow, green, blue, UV plus white) and I intend to use these for building my own crude spectrometer. These LEDS (except the white one) emit light at a very narrow band around a certain wavelength.

With a broadband sensitive lightsensor (or array of light sensors for different wavelength areas) and some electronics I can make a spectrometer.

With this setup I can measure at certain points, but I would like to measure at many more points. Does anyone of you know a means to produce light of any desired wave length at acceptable strength? Of course I can work with bright white light and all kinds of filters, but that seems like a very expensive and difficult setup. I would like most if I could make a light source, with adjustable wavelength.

Any ideas are welcome. My aim is to build a spectrometer at a tight budget of at most $200.

chromium - 21-11-2005 at 04:49

Device that separates one particular selectable wavelength from white light is called monochromator. You can google it there is lot of links.

http://en.wikipedia.org/wiki/Monochromator

Marvin - 21-11-2005 at 04:51

I think you might be better going the other direction. A prism, or a replica grating, some optics and a flatbed scanner. What you are doing currently sounds better suited to specific absorbtion measurements.

Pommie - 21-11-2005 at 04:55

How about a mixture of powders from Florescent lights combined with UV LEDs as a mixed source? Some of the tubes used in fish tanks seem to have a broad spectrum.

Mike.

chemoleo - 21-11-2005 at 05:42

Marvin, where does a flatbed scanner come in? Are you suggesting to use this as a means of detecting transmitted light? I'd think the sensitivity is not high enough...

Anyway, the way I'd do it is this:
Get yourself a broadspectrum light source, which is very intense. It can also be some sort of flash light. I can check with my colleague what lamps a professional spectrometer uses.
Then, focus that light into a tight linear beam, as far as this is possible. The more linear, the better, as this will affect the minimal wavelength range.
Feed this into a quartz prism, which is remotely controlled by a high qual servo.
Dispersed light exiting the prism falls onto a fixed slit (i.e. immovable) of very narrow width (< 1 mm), at i.e. 50 cm away from the prism. Behind this is the sample chamber, for the cuvette containing the sample. Again it has to be quartz if you want to work in UV.
On the exit side of the cuvette is a photodiode, possibly a set of them, with different absorption profiles.
If you calibrate this properly (with a computer program), I am sure you could make this work.
Of course, the position of the prism controls what wavelength of light falls onto the slit, so the quality and calibration of the servo, and the linearity of the beam will be the most important factors.

It's hard but it can be done :)


[Edited on 21-11-2005 by chemoleo]

I am a fish - 21-11-2005 at 12:40

You could greatly increase the resolution by using a wider range of LEDs. They can be bought with far more exacting specifications than the standard "Red, Yellow, Green..." of general-purpose electronics catalogues.

As a starting point, check out the LED Muesum.

Twospoons - 21-11-2005 at 13:04

Your best broadband light source will be a thermal one - tungsten halogen, xenon flash, or a metal halide HID lamp. All the phospors emit on discrete wavelengths, even the so-called broadband fluoros.

A source based on an HID lamp will cover long IR up to UVB or UVC if you get one without a UV filter.

IrC - 21-11-2005 at 14:02

If only one frequency at a time is needed I wonder why a tunable dye laser is not used? Also, Marvin is right the charge coupled imaging device is more than sensitive enough to do the job.

Tacho - 22-11-2005 at 02:47

Please, criticize my idea for a homebuilt spectrometer:

(see attached scheme)

1) two cuvettes are put in the device, one with sample and the other with the solvent alone (reference). Identical photosensors are placed behind the cuvettes ;

2) photosensor 2, behind the reference, keeps servo light shutter with an aperture that keeps it's output (photosensor's output that is) constant no matter how bright the halogen lamp is;

3) a cheap and dirty interface with the computer increases the brightness of the lamp by Pulse Width Modulation, slowly, all the way from low infrared to everything+uv. Of course, the shutter closes as the lamp gets brighter. Reference photosensor output is constant and the sample photosensor output floats (hopefully).

4) another cheap and dirty interface reads the output of the photosensor 1 as the brightness of the lamp is increased.

5) the computer does some math. I think the change in values not the value itself will bring the information. Something in the lines of dX/dY along the brightness path.

spectroidea.gif - 4kB

Pommie - 22-11-2005 at 05:13

Quote:
Originally posted by Tacho
Please, criticize my idea for a homebuilt spectrometer:


Doesn't a dim light still have a broad but shifted spectrum and so to actually work out which wavelengths have been absorbed would require very accurate photosensors and a lot of number crunching.

If you used a slit and a rotating prism in place of your shutter such that the line of light was horizontal and passed through both samples and onto the 2 sensors, I think you would get a better result.

You could still use something like a PIC to control a model servo. I would think that 2048 positions would be possible. A pic could also read both sensors and send the data to the PC. If your familiar with microcontrollers, have a look at the 16F88 at microchip.com.

Mike.

unionised - 22-11-2005 at 05:18

"If only one frequency at a time is needed I wonder why a tunable dye laser is not used?"
IRC, have you seen the prices of a tuned laser and a light bulb?
Laser sources do get used in spectrometry- but not often. The commonest lamps in spectrophotometers are tungsten/halogen or deuterium lamps.

Marvin - 22-11-2005 at 07:34

Using a scanner povides a number of very helpful features. No moving parts. Well, the motor will be moving but this does not have to be connected to the bar or even working, you only need to fake the end stop to trick the software into thinking its scanning a page. No writing software, its all written for you, you only need to use a very basic program to add all the lines together (for less noise).

The optics will be hard particually if the sensor is used directoly (only about 1 inch long), but very sensitive and you only need to disperse a small distance.

Tacho,

I had the same idea for an infra red spectrometer. The math would be very hard, black body emission curves and sensor curves and integrating to get something soluable. Scanning the spectrum would take a long time. Even at the bright end you need extremely low noise, as the noise and the difference in the signal are in the same place. Worse still at the dull red end, your light is neerly just red (with an IR cut off), but its also very very faint, so you need a huge dynamic range for the sensor, very very long capture times for the low noise requirement. Resolution would suck. I can't prove this but I'm certain it would. In the case of an optical spectrometer this would mean thin absorbsion lines would just vanish. With a crude dispersive spectrometer you can use atomic emission, and while they may blur they can't just dissapear.

Tunable dye lasers have the best resolution of any method, but they contain a spectrometer cavity themselves, so building one would be much harder.

Quibbler - 22-11-2005 at 10:20

Search for LED color chart. It would seem you can cover the whole range with reasonable resolution.
Another interseting development is the tunable LED - not available as yet and will probably be expensive.
I seem to remember that LEDs used to change color if you pushed them too hard - green ones would turn slightly orange. Doesn't seem to happen with new ones - or is it just another sign I'm losing my mind.

Twospoons - 22-11-2005 at 13:25

Quote:
Originally posted by Tacho
...Identical photosensors ...


And there you have a rather fundamental problem! It is much better to use one sensor and swap cuvettes - that way all of the measuring equipment is identical for both the test and reference samples, and all the matching, calibration and drift issues just go away.

I like Marvin's idea of using a scanner - you get a nice sensor typically 4000 pixels or bigger, plus some handy optics. The killer is going to be dark current in the sensor if you need long exposure times due to a weak source. This can be overcome to some extent by summing successive exposures - a process called oversampling. This also reduces the noise in the signal by the square root of the number of samples.

Spectral resolution is going to be all in the optics - and its going to be a tradeoff between resolution and light throughput.

vulture - 22-11-2005 at 14:15

Dark Noise in the sensor can be greatly reduced by cooling it. It doesn't have to be LN2, 273K instead of 298K will already show improvement. Besides, I don't think your scanner CCD would like LN2 temperatures.

woelen - 22-11-2005 at 14:27

I do not worry about the noise. The LEDs I ordered are very bright (12000 Cd) at their normal rated current. They also are well-specified (center frequency specified in nm and specification of the 99% power bandwidth around that central frequency). In fact, the LEDs have a very narrow band of just a nm or so of wavelength. My concern indeed is the number of sample points, or stated otherwise, the number of frequencies at which I can measure. I'll see if I can find more different well-specified LEDs. I do not want to buy just some led with a vaguely specified color.

The monochromator or servo mechanism simply is not within my budget. I'm quite sure that these will be WAY beyond my budget of appr. $200.

If I have any results, then I'll let you know. I'm still waiting for the LEDs, but I expect them to arrive one of these days.

-----------------------------------------------

How would a digital camera be as spectrometer? If I take a standard light source, a standard test tube (quarz if UV is to measured as well) and I take a picture of the test tube with solvent only and I take a picture of the test tube with the colored species how well could that be used for spectral analysis. How good are the CCD chips of digitals camera's for that purpose. With some mathematics and analysis of the RGB data I should be capable of deriving spectral information, isn't it?
Problem might be dynamic range. For my website I already noticed that many solution seem black at higher concentration. I need to dilute them for good pictures, but of course that is not always acceptable in coordination complex analysis. Dilution may affect the complexes.

If anyone has an opinion on this, I would appreciate that.

[Edited on 22-11-2005 by woelen]

Twospoons - 22-11-2005 at 15:04

Quote:
Originally posted by woelen
With some mathematics and analysis of the RGB data I should be capable of deriving spectral information, isn't it?


Uh, no. Too much information is lost. e.g. There's no way to determine if the red light falling on a red pixel is at 600nm or 620 nm or 650nm.

You can build a simple monochromator with a couple of slits and a piece of CD. Total budget of about $1. Of course, you get what you pay for ...

You should worry about the noise, as its likely to bury the signal you are trying to see.
Good point about the cooling, Vulture! A peltier cooler would be a simple way to take the sensor down to -20C or so.

woelen - 22-11-2005 at 15:26

Quote:
Originally posted by Twospoons
You should worry about the noise, as its likely to bury the signal you are trying to see.

Sorry for me not being clear. I'm not going to use a scanner's CCD-array, but some light sensitive diodes, with integrated amplifier. I have made a light-intensity meter, which I use in photography and the sensor I used there has a dynamic range of 1 : 10000 or even more. I can measure at 1/1000 of a second with that, but also at shutter times of a few tens of seconds. I have two of these sensors left and these I intend to use for my meter.

Marvin - 22-11-2005 at 17:22

woelen,

Most of these objections arn't aimed towards your idea. Noise will not be a problem. What you are making is more like a colorometer, you'd need 100's of LEDs to get anything like a proper spectrum. This may not be a disadvantage, most UV/Vis curves Ive seen are profoundly dull and contain little information aside from the concentration of a few important coloured species, as opposed to IR which tells you things about the molecule.

With a proper dispersive spectrometer either with a motorised system, or with a static CCD array type you'd have no problems working with things like atomic emission lines as well as everything you're current plan does. And it would cost under $200. If not the scanner method then servo's from an old printer would work fine, a glass prism and an old telecope would get you everything you need to adapt your existing light meter.

Noise would not be a problem with either setup.

Twospoons, the process of adding together samples to reduce noise is called integration over time or sometimes 'frame integration'. Oversampling is a process intended to produce higher resolution using a higher sampling rate than is actually required for the job.

A scanner CCD is pretty sensitive, when you consider the light reflected from the paper is only focused be a lens a few millimeters in diameter an effective 6cm away or so, transmission spectroscopy should be a breeze, even with very thin slits.

Twospoons - 22-11-2005 at 18:09

Marvin, the term 'oversampling' is also used to describe digitising the same thing many times and averaging the result to improve signal to noise ratio. At least in my line of work it is.

Tacho - 23-11-2005 at 02:44

Twospoons,

The reference photosensor just controls the shutter to make sure any change in the sample sensor output is due to the sample absorbtion, not light change.

Marvin,

I'm glad you had the same idea. Shows the principle is sound. I agree that resolution would suck, specially in IR range, but it still could be a nice tool for the amateur to compare samples with known standarts, including the visible light range. Since all materials are available in my attic junk box, I intend to give it a try . Then again, hell is paved with this...

Pommie,

I'm a Z80 man, and it took me great effort to evolve to 8051 (in fact, 89S8252). I'll stop there. No PICs for me.
I recently found out that old Turbo Pascal running on a pentium machine in a DOS enviroment (booted, not a windows' shell) is incredibly fast. I mean really really fast. And it deals with the parallel with simple commands. That's good, because I don't have a nice ansi C compiller for DOS, C doesn't deal easily with the parallel port and I like the old Turbo anyway.

Quibbler - 23-11-2005 at 04:03

Marvin is quite right most UV/Vis spectra are amazingly dull. Most measurements are to determine the concentration and for that all you need is a monochromatic source.
That said I think this is a great idea I am going to make one I am thinking of mounting the leds on a disc and driving it using a stepper motor probably use a LDR for detection to ADC to a PC. One thing to watch out for cuvets unless matched (=expensive) will show a lot of variability so I ALWAYS use the same cuvet for sample and blank.

Marvin - 23-11-2005 at 09:34

Twospoons,

I think I see where the confusion has happened. Oversampling is sampling the data at a higher rate than required by the highest frequency componant. It does not have to be done in one pass though, each pass can sampled with a slightly different phase, in the gaps of the previous sampling sets, so to speak. The oversampled dataset can be made to produce lower noise and higher channel resolution data by a process called decimation.

When a sample is aquired at the same point, or for a DC value, this is not oversampling. Simply adding together the signal and divided by the number is commonly refered to as 'signal averaging' or 'integration' the latter, particulally with imaging systems and CCDs as 'charge integration' together with something to differentiate it from on chip charge integration using long exposures.

Both processes in ideal situations reduce noise by SQRT(n) but since the position of the pixels are fixed on the CCD you cannot perform oversampling.

Twospoons - 23-11-2005 at 12:50

I say "toh - mah - toh" , you say "toh - may - toh".

Quibbler - 25-11-2005 at 11:18

I've had a look at the spectrum of some LEDs. It is possible to get a bit of tuning by putting too much current through.
Green LED
20 mA 565 nm
100 mA 573 nm
180 mA 587 nm
Red LED
20 mA 672 nm
100 mA 687 nm
200 mA 695 nm
in all cases the half height width was about 13 nm. It probably shortens the life of the led doing this and the high currents should not be continuous due to the heating. But it seems possible to get about 20 nm of tuning. A word of caution some cheap LEDs have a much higher band width I bought some cheapos and they have a bandwidth of about 50 nm (as oppossed to the 13 nm).

I've just re-read the specs on your LEDs
12000cd you might want to consider making a death ray instead. And are you sure that the band width is 1 nm you would be lucky to get that from a laser diode.

[Edited on 25-11-2005 by Quibbler]

Overdriving an LED will kill it

zoomer - 25-11-2005 at 14:35

woelen, way cool project, I hope it works out. My 2c:

While overdriving an LED (forcing more current than it's made for) will indeed modify the output wavelength slightly, it dramitically shortens the lifespan of the devise, as in it may last days instead of years. Since you would need to recalibrate every time you replaced an element, I doubt the small variation would be worth it.

A few other LED operation notes:

- All LEDs are made the same way, with simple processes and cheap materials. Between any two similar types, the difference in price comes from testing. Testing of an individual device is the only way to know it's actual characteristics since it cannot be determined with much accuracy before manufacture. Generally, the more expensive a semiconductor, the closer it is to nominal specifications. Some are even sold "certified" where you are given the actual test results for specific device you bought. They are very expensive, US$5-$10 apiece, but may be worth it in this application since that info is critical to you.

- "White" LEDs are really just a blue, green, and red LED on the same die, so in a spectrograph it would have 3 narrow bands, instead of the nice broadband output that you are looking for.

Z

Marvin - 25-11-2005 at 19:51

As has been indicated you can overcurrent an LED without burning it out by very rapid pulsing. The peak current gets you the wavelength shift, the overall power usage determines the lifespan, provided the switching is fast enough. I'm surprised the shift is that much, I'd have though the colour change would be due to unwanted bands apearing in the spectrum, rather than a shift and I'm still pretty convinced thats what is going on witht he green LED turning orange.

White LEDs are generally not 3 colours in the same case, but a blue LED with a broadband phosphor.

Semiconductor lasers have a very narrow bandwidth, and can be tuned very slightly by altering the temperature. Cavity modes are a problem with this method but a red laser diode might be tunable by about 10nm over a 40degree range.

IrC - 25-11-2005 at 23:36

When pulsing be sure to tailor the waveshape and amplitude correctly as the crystal structure can deform or crack, from a piezo type electro mechanical effect. I used to build power supplies for laser diodes for Meredith Instruments and I learned the hard way as this was almost 20 years ago and damn those diodes were expensive back then.

woelen - 26-11-2005 at 07:53

Quote:
Originally posted by Quibbler
I've just re-read the specs on your LEDs
12000cd you might want to consider making a death ray instead. And are you sure that the band width is 1 nm you would be lucky to get that from a laser diode.

Sorry for me being off a factor of 1000 :D :o. Indeed not very smart. Of course, I meant 12000 mcd.

See for example:

http://stores.ebay.de/Michis-LED_LED-Weis_W0QQcolZ2QQdirZ1QQ...

They have many LED's of different colors and the non-whites are specified with the central wavelength mentioned. Brightness is between 5000 and 12000 mcd (not cd :D )

Quibbler - 28-11-2005 at 05:33

I made a mistake too only a factor of two though. My half height widths should be 26 nm (not 13 nm).
I'm pretty sure that if you don't have the over current on for too long not much damage will be done. I am assuming it is the heat disappation that does the damage?
My worry is that Beer-Lambert law only works for monochromatic radiation it's because of the logarithmic stuff it there. But with an LED we know (roughly) what the shape of the emission is (Gaussian maybe?) so if enough points are collected it should be possible to work back to monochromatic.
I find that the following has the largest range of LEDs. They cover those difficult regions 660-880 and 460-520.
http://www.roithner-laser.com/LED_diverse.htm

unionised - 28-11-2005 at 12:37

The Beer Lambert law fails with non- monochromatic radiation, but it isn't to do with the logs in it.
Imagine that you are trying to measure some red chemical by seeing how much green light it absorbs. Unfortunately, your green (monochromated) light isn't as good as you think it is, for example let's say it has some small amount of red light in it. As you increase the concentration of the dye it absorbs more and more of the green light and so less light gets through to the detector. On the other hand, the red light goes through the dye without any problem.
No matter how much dye you put in the solution the detector will never see "zero" light - the closest it will get is when (virtually) all the green light is absorbed by the red dye and all it sees is the red light.
If you plot out the LOG(absorbance) versus the concentration the line will not be straight- it will be close at moderate concentrations but it will look like a failure of the B-L law.
The effect is still present (of course, it's smaller), even if the "wrong colour" light is almost the same wavelength as the "right" wavelength, and that's what you have with non monochromatic light.
You can to some extent avoid this problem by measuring the absorbance at a wavetength where the rate of change of absorbtion with wavelength is small. Normally this means a peak in the absorbtion spectrum but a valley works well too.

(There are similar problems with "stray light";).

Quibbler - 29-11-2005 at 04:17

I'm sure you meant LOG(transmission) against conc. - absorbance is already logged. OK it is an extreme example you have chosen even if the spread of wavelength is such that the molar absorption coeff is different over the wavelength range B-L law will not work. And I'm still sure its because absorbance is proportional to conc, but absorbance is LOG(transmission) so the extinctions do not add nicely.
I guess this really does not matter if you just want a pretty graph abs vs wavelength. KMnO4 is a nice one to try it's the only compound i've found with a marginally interesting visible spectrum.

unionised - 29-11-2005 at 12:00

Oops! Yep, my mistake.
NdFeB magnets disolve in acid (you only need a little one). Nd+++solutions have another relatively interesting spectrum.

If you want to leave the inorganics behind, carotene and chlorophyll are quite interesting too.
Some of the polycyclic aromatics have nice UV spectra but they are in the UV (not to mention the toxicity of some of them).

frogfot - 3-12-2005 at 13:45

Holy cow! What about a homemade HPLC coupled to UV detector? Seems to be easy to make in theory, using silica or cellulose column. There's probably a thread on this.

Just to be on topic, using the standard (commersial) LEDs in homemade spectrometer would be a good way to characterise the compounds among madscientists :)
Say, people can report prepared compounds having absorbtions at specific wavelengths.. mm

[Edited on 3-12-2005 by frogfot]

Tacho - 4-12-2005 at 09:35

I agree that a standart simple homebuilt spectrometer would be great for amateurs to compare their results. I have a few doubts that LEDs will do the job, though. Their band of emmission seems too broad, usually 50nm. Check this from I-am-a-fish link:

http://ledlights.home.att.net/spectra/660.gif

http://ledlights.home.att.net/spectra/spec5.gif

http://ledlights.home.att.net/spectra/orange.gif

http://ledlights.home.att.net/spectra/etggrn.gif

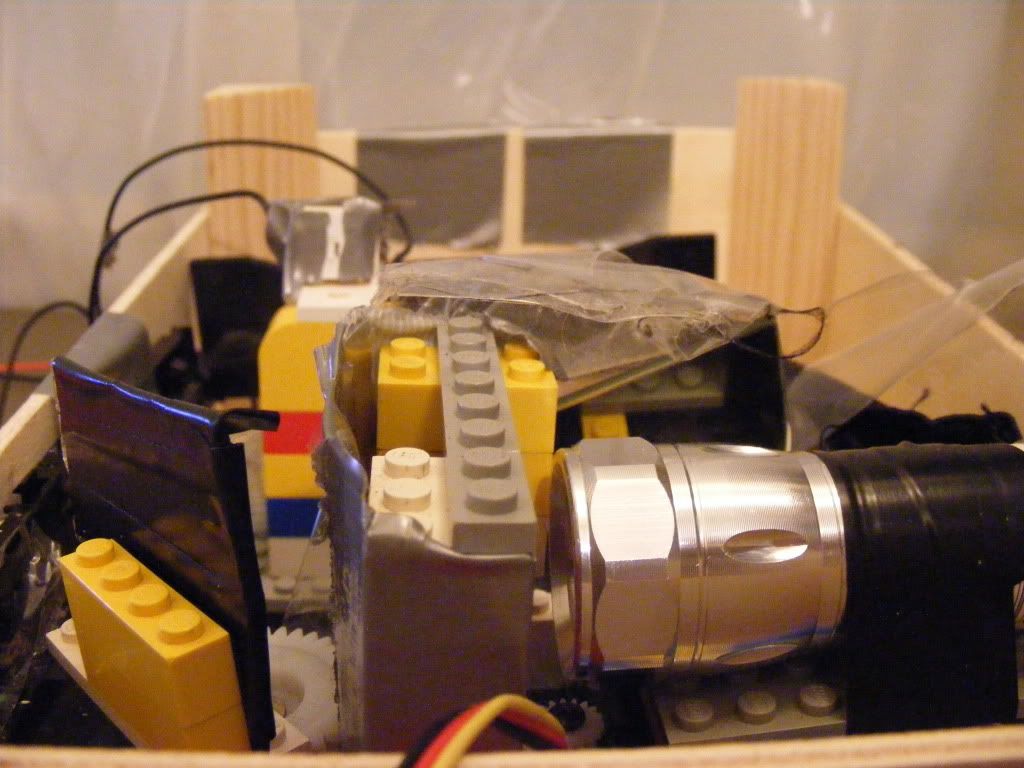
I stoped working on my idea, because I became too interested in Ranque-Hilsch vortex tubes. But, since anyone trying to build an spectrometer is probably going to face some mechanical chalenges, I post the picture and description of my constant light device, because I think the idea is pretty neat and may have other uses for hardware hackers. I used a broken HDD chassis to do 90% of the work for me.

The HDD has an arm that moves the heads from track to track. The arm is driven by a coil in between magnets, so that depending on the direction of the current flowing, it goes back and forward. It's not hard to identify the wires that connet to the coil and make a direct connection to the circuit.

Usually the arm has one beam for each disk. I tore away the unwanted ones.

The chassis already had an oblong slot that I used as a light passage. A photodiode on the other side (in the picture it's not fixed, it's loose for tests) senses the light and feeds a op-amp (classic design) voltage comparator: Too much light and the current flows in one direction, pulling the voice coil arm and shutting the light slot; when too little ligth passes, current reverse its flow, opening the light slot.

Initially it had some vibration, but a 470K ohm feedback resistor made it firm as a rock.


A piece of black paper/foil had to be glued to the arm to make it able to totally close the slot.

The extra circuit you see on the bottom/center of the picture is a 555 based circuit that changes frequency with light changes on photodiode 2 and would be used in the future as the sample sensor- right now it's just connected to a loudspeaker so I can hear it tick. Literally.

I closed the other holes in the chassi with black electric tape, hence the black squares all over the picture.


jimwig - 4-12-2005 at 16:11

Here is what I consider to be excellent how to concerning various spectro type devices.

They are all Scientific American magazines. Available all the over library spectrum of the world.


Spectrograph, astronomical,
1956 Sep, pg 259
Spectrograph. auroral,
1961 Jan, pg 177
Spectrograph. Bunsen's,
1955 June pg 122
Spectrograph. how to make a diffraction-grating type,
1966 Sep, pg 277
Spectrograph, ultraviolet. construction of,
1968 Oct, pg 126
Spectroheliograph. how to make,
1958 Apr, pg 126
Spectrohelioscope. how to construct,
1974 Mar, pg 110
Spectrometer. beta-ray,
1958 Sep, pg 197
Spectrometer. magnetic-resonance,
1959 Apr, pg 171
Spectrometer. mass. how to construct,
1970 Jly, pg 120
Spectrophotometer, construction of,
1968 May, pg 140
Spectrophotometer, recording, how to construct,
1975 Jan, pg 118
Spectroscopy of candle flame,
1978 Apr, pg 154

indigofuzzy - 1-10-2006 at 22:13

Quote:
Originally posted by zoomer
- "White" LEDs are really just a blue, green, and red LED on the same die, so in a spectrograph it would have 3 narrow bands, instead of the nice broadband output that you are looking for.

Z


Actually, Most white LEDs are made with either a blue or near-UV led die and a coating of a yellow-glowing phosphor. This means there are actually two peaks - one in the blue to near-uv, and a wider one in the yellow.

Quibbler - 10-10-2006 at 06:25

Well I've finally made a led spectrophotometer. I managed to get some fairly monochromatic leds with narrow beam angles. I have set up 5 at 490,520,574,612 and 644 nm. If they are slightly angled they can be directed onto one detector - a phototransistor (SFH309). I found LDRs to have too slow a response. The voltage on the phototransistor is converted into a frequency using a LM358 as a VCO (I got the circuit from the National Semiconductor data sheet) The pulses are fed into a computer through the parallel port and counted over 1/2 sec. The leds are swiched using the parallel port also.
I have encountered two major problems led output varies with time hence the short measuring time (1/2 sec), and the dynamic range of the phototransistor is so large that different resitors need to be switched in the VCO to cover any kind of absorbance range.

I am now in the process of trying to calibrate - this is turning out to be very difficult there is a lot of non-linearity here. I hope I can get a simple polynomial fit between raw output and absorbance, but at the moment measuring lots of absorbance standards is proving to be a real pain.

Quibbler - 12-10-2006 at 06:54


I've taken a piture of it. In the middle is the sample holder (white circular thing) this is a piece of PVC pipe. The board on the left is the detector board (the phototransistor has a piece of red tubing over it to limit reflected light). On the right is the LED switching board.

12AX7 - 12-10-2006 at 09:20

Don't forget that silicon loves exponentials. You'll need a high order polynomial to equal that ;)

It should be that light input is proportional to current flow through a photojunction, which is then exponential (Eber-Molls equ.) through the transistor.

Tim

Twospoons - 12-10-2006 at 12:41

if the LED output varies with time, maybe they are being overdriven, heating up and thus changing output. Perhaps you should allow each led sufficient on-time to stabilise thermally.

A photodiode (in reverse bias photocurrent mode) is a better choice for linearity - as 12AX7 points out :phototransistors have exponential response. If you can, pick one for which there is a quantum efficiency curve in the datasheet - that will tell you relative sensitivity to different wavelengths.

Your optical setup may benefit from a diffuser in front of the LEDs (frosted glass?), with a lightpipe of around 5-10cm length to even out the illumination field (glass, acrylic or bright anodised Al tube), since you can't physically put the LEDs in the same place.

Polverone - 13-10-2010 at 12:24

Old thread bump: Alexander Scheeline has made a guided inquiry project for students that revolves around building a spectrophotometer with cell phone hardware. It could be used as-is or taken as a jumping off point for something more advanced.

Do it yourself Spectrophotometer

franklyn - 21-1-2011 at 03:00

How useful is it to have a spectrophotometer for identification and analysis of organic materials ?
I understand it has wider application in biochemistry than in organic chemistry. While I perused
analytic instruments on EBAY I found this item. Given the usual cost of such things it looks tempting.
http://cgi.ebay.com/ws/eBayISAPI.dll?ViewItem&item=31028...
http://www.cienytec.com/PDFS/Espec_SPEC20_OpMan_ing.pdf

I then searched the topic some and discovered that a computer utility exists which with simple gear
as can be seen below, will analyze a jpeg photo taken with a digital camera as would a dedicated
spectrophotometer instrument. Literally a do it yourself project. How cool is that !

- Ha ! Polverone beat me to it -

http://www.news.illinois.edu/WebsandThumbs/scheeline,alex/sp...


- The story -
http://www.wired.com/gadgetlab/tag/spectrophotometry
http://www.news.illinois.edu/news/10/1007scheeline_spectroph...

- How to -
http://www.asdlib.org/onlineArticles/elabware/Scheeline_Kell...

- More
http://www.asdlib.org/onlineArticles/elabware/Scheeline_Kell...

- Download the stand alone program here -
http://www.asdlib.org/onlineArticles/elabware/Scheeline_Kell...

.

Ephoton - 19-11-2011 at 05:48

not sure if this has been posted here yet and sorry to bring up an old subject
but there was a guy in the Czech Technical University that made a nir spectrometer
that scans from 400nm too 900nm.

he placed his build cost at 25 euro and has handed up for evaluation a spectrometer
with usb connectivity and full plans that include all electronics theory and code to
run it.

I havent seen it untill tonight and I was looking into a stellarnet for over a thousand
dollars with simular capabilities.

It is far from perfect but a great start I think.
http://fzu.cz/~dominecf/electronics/usb-spect/usb_spectromet...

mayko - 1-6-2013 at 05:38

Cool work everyone!

My first stab at DIY spectrophotometry was quite crude, consisting of a tube, a flashlight, and a transmission diffraction grating. This passed light through the sample and projected the resulting spectrum onto the wall. A CdS sensor from an automatic nightlight was mounted on a graphing calculator to slide back and forth through the spectrum, and measurements were taken by hand with a multimeter.


Next step: I mounted the device in a wooden box (used to contain clementine oranges). A flashlight beam was passed the sample and a slit, and the beam was bounced off of a reflection transmission grating (a piece of a CD). Because the grating was on top of a servo motor, it could be rotated, which would scan the spectrum across the sensor. All of this was controlled by an Arduino and a Python script.


I've also put together an FAQ section and bibliography of other DIY Spectro projects. Next time I update, I'll add this discussion :)


Version I

Version II

FAQ/Biblio

White Yeti - 1-6-2013 at 08:23

I don't know if this is helpful, but LED wavelength output is temperature dependent.

Bring out the liquid nitrogen!

http://www.youtube.com/watch?v=4w1HifFayNU

What you could do is measure the rate of change of wavelength with respect to time, assume that output intensity is fairly constant. Then you can sweep the spectrum with just a few LEDs.

Even better, cool multiple LEDs simultaneously so that the frequency range of one LED ends where the frequency range of another LED begins.

How does that sound?

nezza - 10-7-2013 at 11:18

I too wanted to be able to visualise and measure spectra. This is how I went about it.

1. I bought a simple direct view spectroscope (From Patton Hawksley).
2. Araldite it to a compact camera making sure the spoectrum can be sphotographed
3. Work out where in the image the spectrum falls.
4. Use Paint shop pro to cut out the same part of the image each time.
5. Blur and tidy the image up a bit.
6. Import into BBC basic and run a program to measure the peaks.

The output was calibrated using lasers of known output frequency.

I have added a couple of pictures of the modified camera and the final output.


Camera 1.JPG - 125kB Camera 2.JPG - 129kB Laserspectrawithnames.jpg - 67kB Boronspectrum.jpg - 51kB

bfesser - 10-7-2013 at 12:20

Wonderful! Thank you for sharing this. Now we'll have a use for any old digital cameras we have lying around, collecting dust. I had been waiting for the <a href="http://store.publiclab.org/products/desktop-spectrometry-kit" target="_blank">Desktop Spectrometry Kit</a> <img src="../scipics/_ext.png" /> from <a href="http://publiclab.org/" target="_blank">Public Lab</a> <img src="../scipics/_ext.png" /> to become available. You may object that it's a little pricey at 40USD, but I think it's a pretty slick solution and hope to purchase one with my next tax refund. They also have a <a href="http://store.publiclab.org/collections/spectrometry/products/foldable-mini-spectrometer" target="_blank">Foldable Mini Spectrometer</a> <img src="../scipics/_ext.png" /> which works with smart phone cameras; 10USD for the kit or <a href="http://publiclaboratory.org/wiki/foldable-spec#make-your-own" target="_blank">print/scrounge your own</a> <img src="../scipics/_ext.png" />. Their <a href="http://www.kickstarter.com/projects/publiclab/infragram-the-infrared-photography-project?ref=card" target-="_blank">Infrared (IR) Photography Project</a> <img src="../scipics/_ext.png" /> also looks promising ('237% funded' on Kickstarter!).

<table><tr><td><img src="http://cdn.shopify.com/s/files/1/0198/8618/products/new-in-use_1024x1024.jpg?627" height="150" /></td><td><img src="http://cdn.shopify.com/s/files/1/0198/8618/products/IMG_0096_1024x1024.jpg?627" height="150" /></td><td><img src="https://s3.amazonaws.com/ksr/projects/543414/photo-main.jpg?1368160905" height="150" /></td><td><img src="http://www.adafruit.com/images/medium/1367top_MED.jpg" height="150" /></td></tr><tr><td>Desktop Spec. Kit</td><td>Foldable Spec. Kit</td><td>'IR Photography Project'</td><td>RasPi Camera Module</td></table>
Finally, I'm very excited that the <a href="http://www.raspberrypi.org/archives/tag/camera-board" target="_blank">Camera Module</a> <img src="../scipics/_ext.png" /> for the <a href="http://www.raspberrypi.org/faqs" target="_blank">Raspberry Pi</a> <img src="../scipics/_ext.png" /> (RasPi) is finally available (from my favorite vendor, <a href="http://www.adafruit.com/category/105" target="_blank">Adafruit</a> <img src="../scipics/_ext.png" />;)! I look forward to using these for astrophotography, IR photography, microscopy, and possibly building a RasPi based spectrophotometer with my damaged Chinese Model B rev 2&mdash;the UK board is safe. I hope that someday we'll all have near-IR&ndash;Vis spectrometers in our home labs or even in our pockets.

TL;DR: <a href="http://publiclaboratory.org/wiki/foldable-spec#make-your-own" target="_blank">Click here!</a> <img src="../scipics/_ext.png" />

phlogiston - 10-7-2013 at 14:39

nezza, do you know the output signal vs. light intensity at different wavelengths for you camera? In other words: (how) do you calibrate the intensity scale?

AndersHoveland - 10-7-2013 at 14:54

Quote: Originally posted by Quibbler  
I've had a look at the spectrum of some LEDs.

I have several LED light bulbs. While the light is yellowish "white", I do not care for the light they give off. They do not have the same spectrum as incandescent, and it looks a little strange, difficult to describe. The white LED light is like a fluorescent yellowish tinted with purplish blue, and a little pinkish colored at the same time.

When I looked at the white LED light through a prism, the deep red was not as brilliant, it was more orangish, and the band where there should have been a green-blue and light blue color was very dim.

The light from a typical fluorescent lamp has just 3 bright lines, red, green, and blue. There are also a few violet lines, and blurry very dim bands in the yellow and lighter blue, if one looks closely. Definitely not a full spectrum light source.

I have also looked at the spectrum of metal halide street lamps with a CD grating. Many distinct bands of colors. The strange thing that do not understand is there is a bright thick yellow-orangish band that fades outward, but in the center of this band is a clear distinct dark line. Is this the sodium line? Is there some sort of forbidden quantum state between those two lines?

[Edited on 10-7-2013 by AndersHoveland]

bfesser - 10-7-2013 at 16:19

As I posted <a href="viewthread.php?tid=19214#pid240805">before</a>, I have an abnormal amount of lighting knowledge and experience. In my experience, Philips LED lamps are far superior to any others I've tested, and they are the only LED lamps I currently recommend. They're expensive as hell, but the quality is unmatched and the longevity pays off. At my previous job, we even installed them upside down inside freezers (below -20 &deg;C), no problem! In the whole time I was there, only one of the lamps failed, and it was an early generation lamp which had been run continuously for maybe two years. I've replaced most of the lamps in my apartment with these, and I love them.

These are the two styles I recommend for standard home use:
<img src="../scipics/user:bfesser/post_pics/philips_LEDs.jpg" />

They get warm, but not untouchable. Unfortunately I don't have any expendable CDs or DVDs at the moment, otherwise I would report back with some observations.


nezza - 10-7-2013 at 23:30

Reply to phlogiston's question. That's the problem. I get nice peaks, but have not been able to calibrate the output peak height to give a quantitative figure of output at different wavelengths.

bfesser - 11-7-2013 at 06:26

<strong>nezza</strong>, any chance you could share the tool you use to measure the peaks with us? Or, perhaps I've misunderstood your explanation. As I understand it, you've written a utility in <a href="http://en.wikipedia.org/wiki/BBC_BASIC" target="_blank">BBC BASIC</a> <img src="../scipics/_wiki.png" /> that processes the image data. Maybe I should dig out my copy of <strong><a href="http://www.wiley.com/WileyCDA/WileyTitle/productCd-0471856134.html" target="_blank">BASIC Programming for Chemists: An Introduction</a></strong> <img src="../scipics/_ext.png" />.

nezza - 12-7-2013 at 10:44

Yes. The program was written in R. T. Russels BBC basic for PC. The program allows you to import bitmap images and interrogate each pixel in that image to get colour and brightness information. I have attached a text file of the program. the program takes a 1024x200 pixel image and analyses 100 of the 200 pixels in each column. The sum brightness is plotted and the maximum is displayed.

Attachment: spectrum.txt (2kB)
This file has been downloaded 569 times